Monitoring and Reporting
There are several ways to configure statistics in Unbound. In this section we’ll cover Munin and Cacti, but there are many other third-party options available as well, using for example Zabbix or Prometheus.
Configuration
Unbound has an option to enable extended statistics collection. If enabled, more statistics are collected, for example what types of queries are sent to the resolver. Otherwise, only the total number of queries is collected.
Statistics can be printed to the log file using
statistics-interval, but
here we’ll focus on using unbound-control(8) to obtain
statistics on demand. If you set a statistics-interval, every interval it is
printed to the logfile.
To use unbound-control, first set it up using the
unbound-control-setup script.
See howto setup unbound.
Then you can use the unbound-control
stats command to print out the statistics on
demand.
Various graphing tools expect the counters to go up over time. Some may expect
counters to be reset to 0 since the previous statistics printout. The
statistics-cumulative option
controls the behaviour of Unbound.
By default it is set to no, which resets values to zero after stat
printout.
# enable extended statistics.
server:
   statistics-interval: 0
   extended-statistics: yes
   # set to yes if graphing tool needs it
   statistics-cumulative: no
Statistics with Munin
In the contrib directory in the source of Unbound is the unbound_munin_
plugin script. It can be used with Munin to
monitor the health of an Unbound server.
Install munin and munin-node with the appropriate package install tool.
The plugin script for Unbound can be copied somewhere on the system (such as in
the unbound directory). Then create symbolic links from /etc/munin/plugins
to that file.
$ ln -s /etc/unbound/unbound_munin_ /etc/munin/plugins/unbound_munin_hits
In the /etc/munin/plugin-conf.d/plugins.conf file you can setup the Munin
plugin for Unbound. Below are the default values. Set the correct values for
your system. The statefile is a temporary file.
[unbound*]
user root
env.statefile /usr/local/var/munin/plugin-state/unbound-state
env.unbound_conf /usr/local/etc/unbound/unbound.conf
env.unbound_control /usr/local/sbin/unbound-control
env.spoof_warn 1000
env.spoof_crit 100000
Restart the munin-node daemon. Munin will automatically pick up the new graph
and plot it with rrdtool.
Additional graphs are possible, below is a list of them, and examples. Create
(additional) symbolic links to unbound_munin_ with the names (in bold) of
those graphs to enable their display. Several require that
extended-statistics is enabled in
the configuration.
Pictures included are samples, your statistics may look different :-) .
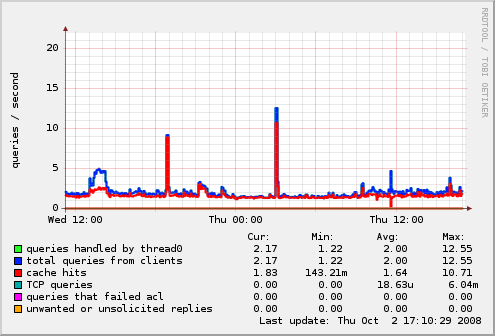
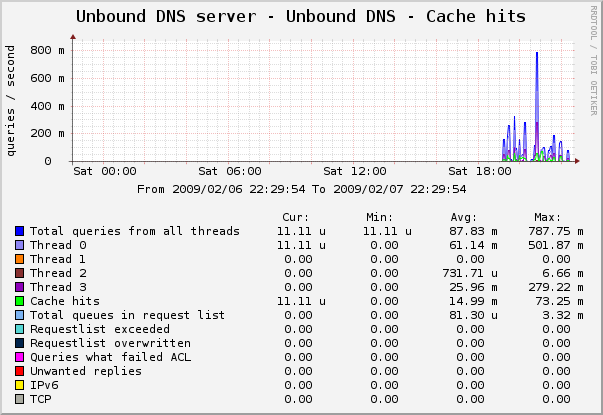
unbound_munin_hits - base volume, cache hits, unwanted traffic
A sharp increase in unwanted traffic indicates a possible spoof run in progress.
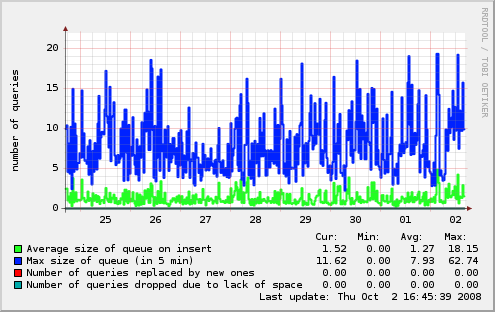
unbound_munin_queue - to monitor the internal requestlist
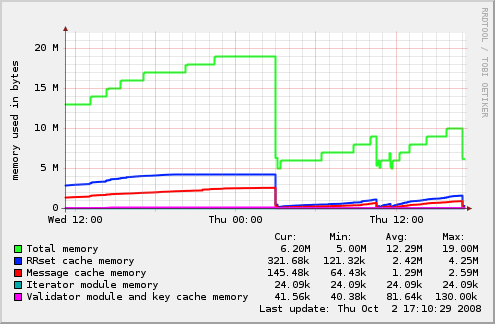
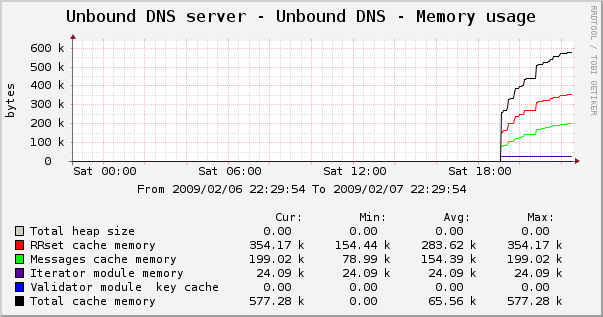
unbound_munin_memory - memory usage
You can see that the server was restarted during the day.
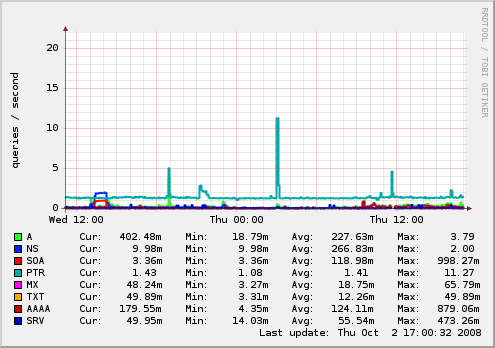
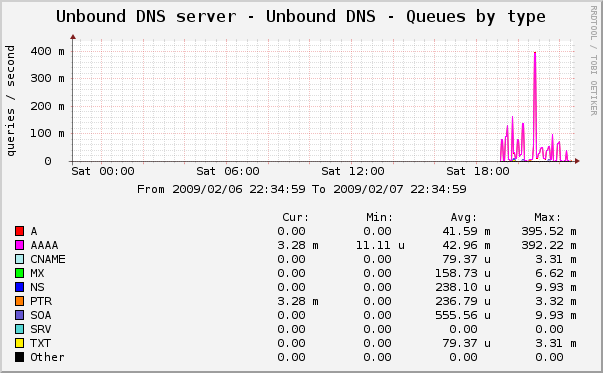
unbound_munin_by_type - incoming queries by type
The types received are shown.

unbound_munin_by_class - incoming queries by class
Usually only IN (internet) class.
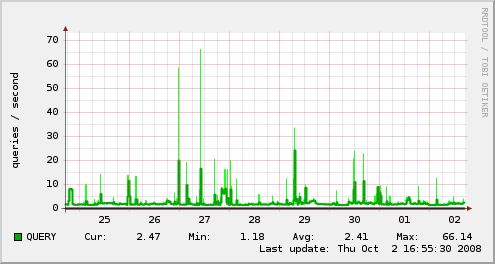
unbound_munin_by_opcode - incoming queries by opcode
Usually only QUERY (normal query).
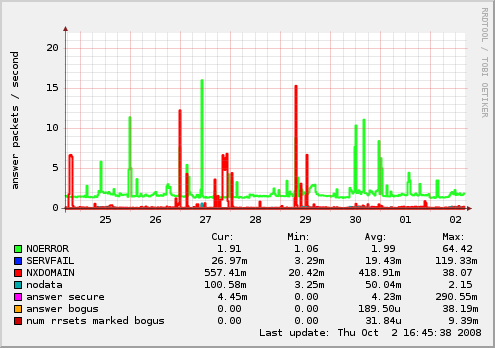
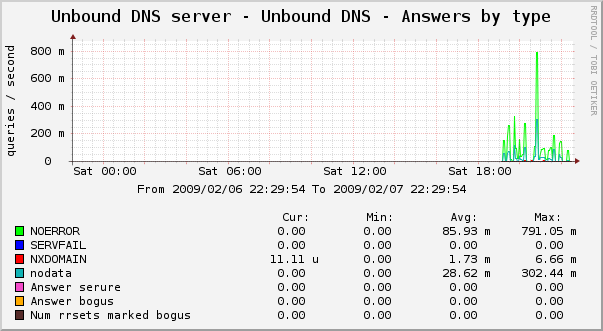
unbound_munin_by_rcode - answers by rcode, validation status
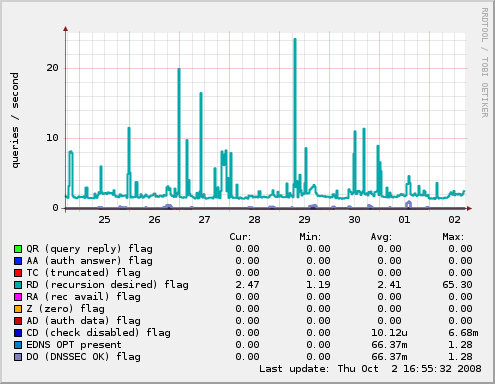
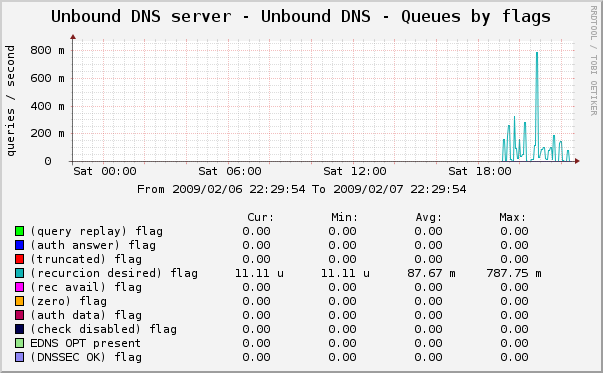
unbound_munin_by_flags - incoming queries by flags
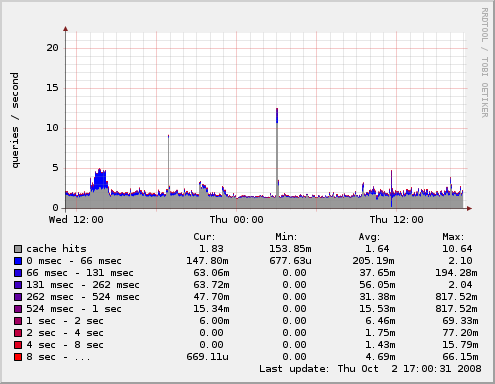
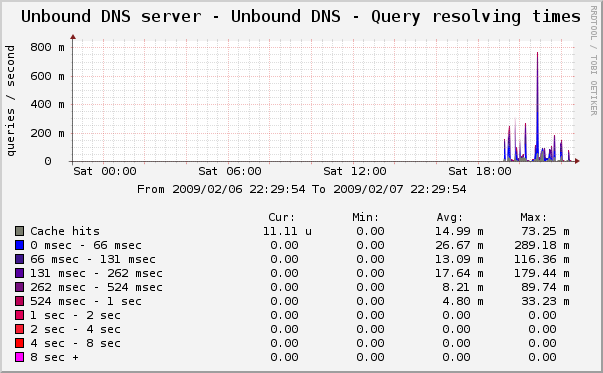
unbound_munin_histogram - histogram of query resolving times
Statistics with Cacti
The setup is described in the README in the tarball in the Unbound source
contrib directory: contrib/unbound_cacti.tar.gz
(contributed by Dmitriy Demidov).
Example output from unbound cacti statistics: